Introduction
Injury is a leading cause of illness, disability and premature death in Australia.1 The influence of socioeconomic deprivation on health is generally well documented with a person’s socioeconomic status an important contributing factor for injury. The social gradient phenomenon, which confirms that the most disadvantaged will be hospitalised at higher rates, has been reported across international studies using aggregated national/regional incidence data for disease and individual/area measures of social deprivation.2,3 These studies report links between socioeconomic status and injury,4 where lower socioeconomic status is associated with increased risk of injury, death, hospital admission and presentation to an emergency department at all levels.5
Few Australian studies have analysed the link between socioeconomic status and injury, morbidity and mortality or the variations between age groups. The relationship between socioeconomic status and facial trauma is a framework that could increase our understanding of the factors related to patient presentation and management. Despite public health and medical data, there is paucity of evidence in surgery regarding socioeconomic determinants and mechanisms of injury for facial trauma across age groups and settings, posing challenges to prevention and management. The theory of ‘fundamental causes’ predicts that socioeconomic status is more strongly associated with health outcomes based on prevention and treatment for which resources are socially distributed.6 This is reflected in Laflamme and colleagues’ European study from 2009 that reported a relationship between morbidity and socioeconomic status where people with low socioeconomic status tended to have significantly higher mortality than those with high socioeconomic status.7 There are many factors involved, ranging from access to care, ecological determinants on health and disease and disease status, that impact an individual’s health outcome.
The presentation of epidemiological analysis of facial fracture by geographical region provides an opportunity to identify trends and target interventions to reduce the incidence of facial trauma and their associated personal, social and economic sequelae and costs. South Australia (SA) covers a land area of 983,482 square kilometres housing a population estimated at 1,676,653 with the majority (77%) residing in Adelaide and metropolitan areas.8 There are 10 local health networks that cover SA with links to networks in rural Northern Territory (NT) and New South Wales (NSW). There are two major centres for the treatment of facial fractures—the Royal Adelaide Hospital for adults and the Women’s and Children’s Hospital for paediatric patients—with the SA facial fracture service representing the major and leading centre. The SA facial fracture service is the principal tertiary and quaternary trauma service for the region, using the skills of plastic, oral and maxillofacial and craniofacial surgical teams.
The objective of this SA study is to analyse the epidemiological trends of facial fractures within a unique service and assess the relationship between socioeconomic disadvantage and maxillofacial fractures and clinical outcomes.
Methods
Study setting
A retrospective population audit was conducted at the Royal Adelaide Hospital (RAH) and the Women’s and Children’s Hospital (WCH) from January 2012 to January 2017 for patients who presented with facial fractures across SA, rural NT and NSW. The SA facial fracture service at the RAH is a unique disciplinary setting that draws on the skill set of plastics, craniofacial and oral maxillofacial surgeons to collaboratively improve outcomes for skeletal, vascular or soft tissue injury. The unit treats over 600 patients annually including in- and outpatients. The model of care represents a collegial approach that fosters shared decision-making, vocational education and clinical governance across the specialty of facial trauma. The excellence of the service moves away from historical anatomical boundaries to a clinical service designed to meet the patient’s requirements based on the pathology of facial trauma.9
Study design and data collection
Patients who are referred for multidisciplinary management of facial fractures are routinely assessed by a surgical trainee and/or surgeon. A comprehensive history is taken, the injury is assessed and a management plan formulated. The demographic, clinical data and management plans recorded by the respective teams are collated and regularly presented at an audit meeting where all cases are reviewed by the plastics, craniofacial and oral maxillofacial surgical teams. This study included patients with a facial fracture treated as either in- or outpatients. Overseas patients were not included in the socioeconomic analysis. Each specialty regularly collects data and the pooled medical records, progress notes, imaging and operative notes from the three teams of plastics, craniofacial and oral maxillofacial surgery were retrospectively collated into a registry and reviewed. Ethics approval was granted from the RAH Human Research and Ethics Committee [HREC/17/RAH/402; HREC/17/WCH/962A].
The following recorded parameters were analysed for this project:
-
Demographic information:
sex, age, indigenous status, alcohol use and year.
-
Socioeconomic parameters and timing of injury:
timing of injury, postcode and socioeconomic index for areas.
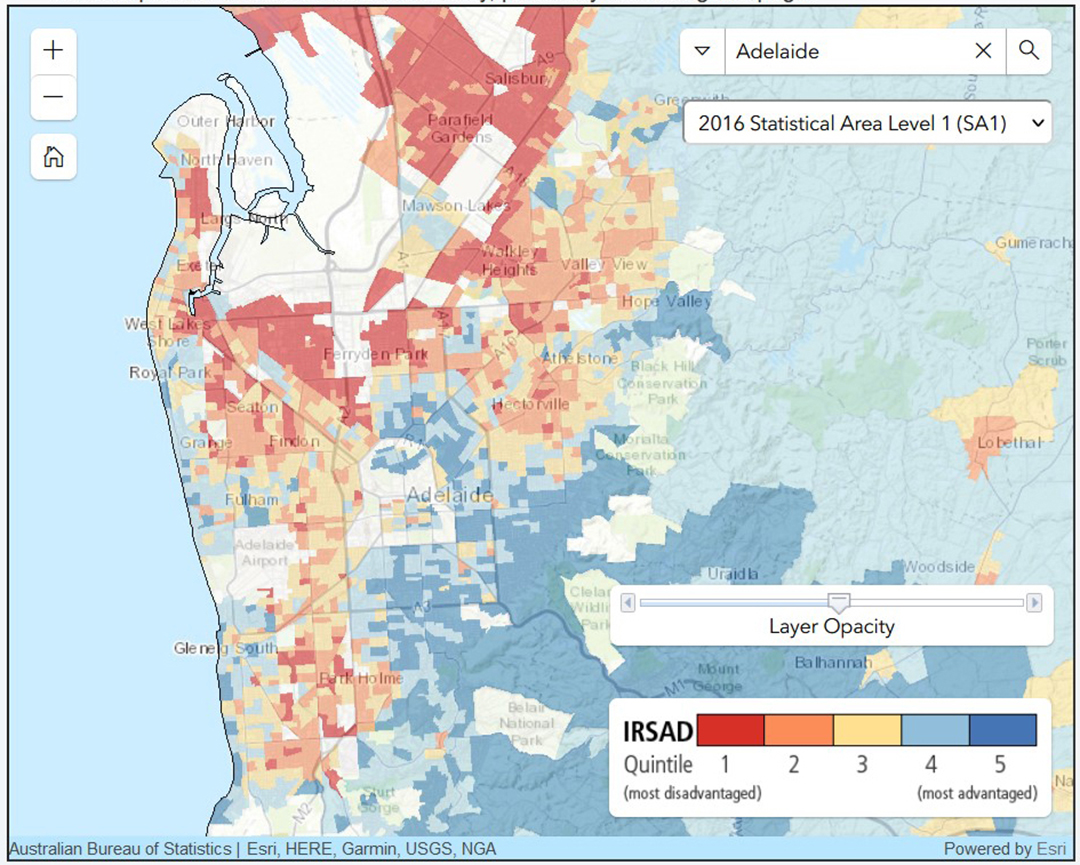
Socioeconomic parameters and timing of injury (SEIFA) is a measure of disadvantage created by the Australian Bureau of Statistics that defines relative socioeconomic advantage and disadvantage in terms of people’s access to material and social resources and their ability to participate in society.10 The SEIFA score was assessed from patients’ postcodes and analysed in conjunction with the Australian Bureau of Statistics framework. Each person’s residential local area was given a statistical score that was used as the area-based composite measure of socioeconomic status from the index of relative socioeconomic advantage and disadvantage (IRSAD) (Figure 1). Overseas patients were excluded from socioeconomic parametric analysis.
-
Aetiology and type of injury:
Aetiology (assault, fall, work, sport, road traffic accident—RTA, animal, other), type of injury11 (nasal, mandible, orbit, orbitozyogmatic, zygomatic arch, panfacial, naso-orbitoethmoid—NOE, dentoalveolar, frontal sinus, middle cranial base, posterior cranial base), and associated injuries.
-
Treatment, complications and hospitalisation:
Treatment (conservative, open reduction internal fixation—ORIF), postoperative complications, admissions, re-operations, and length of stay.
_map_for_central_adelai.jpg)
Costs
Values were calculated for direct costs using the national standard diagnostic related group average price in collaboration with the Independent Hospital Pricing Authority.12 Australian Refined Diagnosis Related Groups is an Australian patient admission classification system that provides a clinically meaningful way of relating the number and type of patients treated in a hospital to the resources required by the hospital. Each group represents a class of patients with similar clinical conditions requiring similar hospital services.13
Statistical analysis
A statistical analysis using IBM SPSS Statistics version 26.0 (SSP Inc, 233 S Waker Drive, 11th floor, Chicago, Illinois 60606-6307, USA) was computed for continuous variables assessing the relationship between linear data and correlation based on a level of significance (p = 0.05). Continuous variables were expressed as mean and standard deviation (SD) or as median and interquartile range (IQR). A paired independent t-test and Pearson Chi test were conducted to assess differences between groups. A multivariable logistic regression analysis was performed to determine potential risk factors attributed to clinical outcomes based on SEIFA (IRSAD) quintiles for socioeconomic disadvantage. A one-way analysis of variance (ANOVA) test was performed to assess mean differences in length of stay among groups.
Results
Demographics and timing of injury
There were 2559 patients between January 2012 and January 2017. There were 1976 males (77.2%) and 583 (22.8%) females with a mean age of 34.6 years (SD ± 18.0) and 48.3 years (SD ± 26.2) respectively. Indigenous people represented 5.7 per cent of the cohort with 106 men and 39 women. There were 355 elderly patients (> 65-years-old, 13.9% of total). The highest number of facial fractures occurred in the 25–35 age group (22.4%). Alcohol consumption at the time of injury was present in 454 patients (17.7%). The most prevalent season for a facial fracture was autumn (28.1%) followed by winter (25.7%). The highest incidence of presentations to an emergency department occurred at night (28.8%), followed by the afternoon (28.5%). The most disadvantaged group had the greatest proportion of facial fractures (36.9%, Table 1).
Aetiology
Mechanism of injury
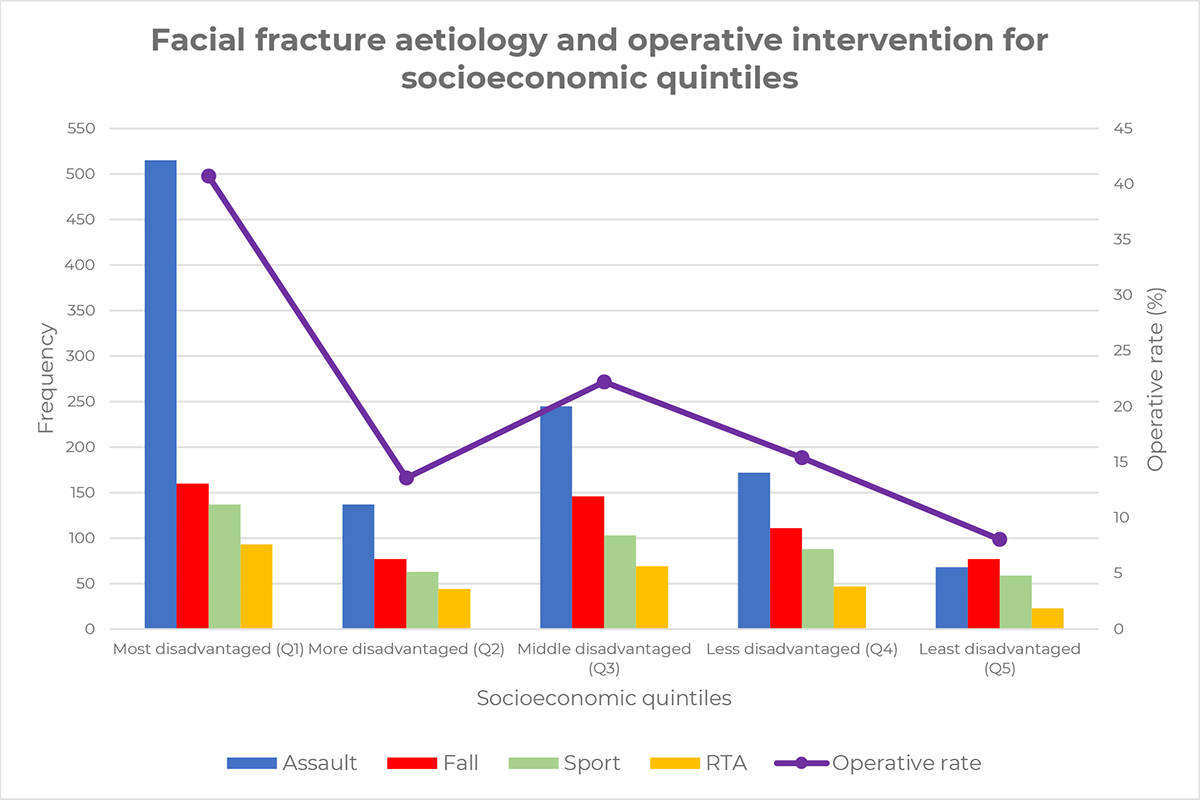
The most common mechanism of facial fracture was assault (44.6%), followed by falls (22.5%), sports (17.7%), and RTA (11.1%). Assaults occurred most frequently in the 25–35 (30.1%) age group with 30.8 per cent of total assaults resulting in mandibular fractures. Of all falls, 50.1 per cent occurred most frequently in the elderly with 30.6 per cent of total falls resulting in orbitozygomatic fractures. One out of five RTA related facial fractures occurred in the 18–25 age group with 29.7 percent of total RTA resulting in orbitozygomatic fractures. In the under 18 age group, there were 33.0 per cent sport related facial fractures with 30.8 per cent of total sport injuries resulting in mandibular fractures. The majority of work-related fractures occurred between 35–65 years with 30.4 per cent total work-related injuries resulting in orbitozygomatic injuries. Animal related fractures were normally distributed with a peak at 35–45 years with 24.0 per cent of total animal injuries resulting in orbital fractures. Assaults represented 69.0 per cent of all fractures and was the most common mechanism of injury for indigenous people. A detailed analysis of results for age groups can be found in Appendix 1.
The odds of all mechanisms of injury were significantly higher for the most disadvantaged (p < 0.001, Table 2) than least disadvantaged. The gradient for RTA and work related injuries increases from the least disadvantaged to most disadvantaged in a linear manner, whereas fractures relating to assaults, sports, falls, and animals decrease overall, with variations fluctuating between the most disadvantaged and middle disadvantaged groups.
Age adjusted stratification
For assaults, age adjusted stratification showed a statistically significant association between socioeconomic disadvantage and facial fractures (Table 3), particularly among age groups: 18–25 (p = 0.010), 35–45 (p = 0.004), 45–55 (p = 0.005), 55–65 (p = 0.043). The likelihood of having a facial fracture from assault decreased with increasing quintile of advantage compared to the most disadvantaged. Almost half of the assaults occurred in the most disadvantaged group for males and females respectively (Table 4). In the least disadvantaged group, the odds of a male and female having a facial fracture from assault were less likely (41.1% and 11.8% respectively) compared to the most disadvantaged group (p < 0.001). Indigenous people were three times more likely to have a facial fracture from assault compared to non-indigenous people, but less likely to have a facial fracture from a fall (OR = 0.410) or playing sport (OR = 0.294, Table 5).
For falls, the least disadvantaged age group (45–55 years) were 3.2 times more likely to have a facial fracture from a fall than the most disadvantaged (p = 0.035). For sport related injuries, age adjusted stratification showed a significant association between socioeconomic disadvantage and facial fractures particularly among the under 18 years (p = 0.003) and 18–25 age group (p = 0.034). Young people from quintiles four and five (less and least disadvantaged) were approximately three times more likely to have a facial fracture from sport than the most disadvantaged. Injuries related to RTA, work, animals and other did not demonstrate significant aetiological associations by age group for socioeconomic disadvantage.
Fracture type
Types of facial fracture
The most common facial fracture was orbitozygomatic (27.7%), followed by orbit (26.5%) and mandible (24.0%, Table 1). Orbitozygomatic fractures most frequently presented in the elderly (22.0%). One quarter of orbital fractures presented in the 25–35 age group. Mandibular fractures frequently presented in the 18–25 age group (28.0%), whereas the 25–35 age group had the highest proportion of nasal fractures (21.0%) and zygomatic arch fractures (27.0%). One third of dentoalveolar fractures occurred in the 35–45 age group. Panfacial fractures were almost equally distributed among each age group. Approximately one quarter (26.0%) of NOE fractures were seen most prevalently in the 18–25 age group. Frontal sinus fractures were positively skewed with the majority under 35 years (62.0%). Middle cranial base fractures had two peaks, one in the paediatric and the elderly respectively, whereas posterior cranial base fractures occurred exclusively in the paediatric age group (Appendix 2).
Approximately three quarters (75.3%) of patients who sustained a facial fracture did not have an associated injury. Soft tissue injuries and neurological injury occurred in 5.5 and 5.4 per cent of patients respectively. Cervical spine fractures were identified in 44 patients (1.7%) with a facial fracture.
Odds ratios for fracture type
The odds of all fractures for the most disadvantaged were significantly higher than the least disadvantaged (p < 0.001, Table 6). The gradient decreases significantly for all fractures from the most disadvantaged to least disadvantaged. However, the gradient does not consecutively decrease in a linear way per quintile for all fractures. Among all fractures there are fluctuations of odds between the less disadvantaged and the least disadvantaged.
Age adjusted stratification
In the middle disadvantage group, nasal fractures in the elderly were less likely (28.4%) to have a nasal injury compared to the most disadvantaged group (p = 0.043). Mandibular fractures in the middle disadvantage group were less likely (49.6%) to have an injury compared to the most disadvantaged group (p = 0.031). The least disadvantaged group were four times more likely to have a frontal sinus injury compared to the most disadvantaged (p = 0.024). Orbit, orbitozygomatic, zygomatic arch, dentoaveolar, panfacial, NOE, middle cranial and posterior cranial base did not show any statistically significant odds by age group (Appendix 3). In contrast, indigenous people were 2.6 times more likely to have a mandibular fracture than non-indigenous and less likely (40.0%) for orbitozygomatic fractures compared to their counterparts respectively (p < 0.05, Table 5).
Treatment, complication and hospitalisation
Treatment
Just under half (49.9%) of patients received an operative intervention and the remaining (50.1%) were managed conservatively with serial reviews (Figure 2). The least disadvantaged were less likely (60.8%) to have an ORIF compared to the most disadvantaged (p < 0.001, Table 7). In the less disadvantaged group (quintile 2), under 18 years were 2.3 times more likely to have an ORIF compared to the most disadvantaged. In the middle disadvantaged group (quintile 3), those between 25–35 years were less likely (52.9%) to have an ORIF compared to the most disadvantaged. Indigenous people were 2.8 times more likely to have surgery (ORIF = 2.3) than non-indigenous counterparts (p < 0.05, Table 5).

Complications and hospitalisation
The postoperative complication rate was 4.7 per cent. Major complications included malocclusion, non-union, plate exposure and enophthalmos. Minor complications included wound dehiscence, analgesia management and respiratory complications. The most common postoperative complications were equally infection and analgesia management, extending length of stay (1.4% respectively). Indigenous patients were 3.2 times more likely to have postoperative complications than non-indigenous patients (p < 0.05). The total rate of re-operation was 2.1 per cent. Indigenous patients were less likely (3.6%) to have re-operations than non-indigenous patients (p < 0.05). The median length of stay was 1.0 days (mean = 3.1 days, Table 8) with no significant differences between socioeconomic groups, although indigenous patients had a significantly longer stay of 3.7 days compared to non-indigenous patients (6.6 vs 2.9, p < 0.001). The admission rate was over half (56.0%) with the remaining patients managed in outpatient clinics. Indigenous patients were 2.8 times more likely to be hospitalised than their counterparts (p < 0.05, Table 5). Compared to the most disadvantaged group, there were significantly decreasing odds of hosptialisation and surgery per quintile of advantage (Table 7).
Patient consent
Patients/guardians have given informed consent to the publication of images and/or data.
Disclosure
The authors have no conflicts of interest to disclose.
Funding
The authors received no financial support for the research, authorship or publication of this article.
Revised: 2 July 2021