

Introduction
Most plastic and reconstructive procedures affect appearance in some way, regardless of whether they are reconstructive or cosmetic. In research about conditions presenting to plastic surgeons, it is therefore reasonable that an understanding of the baseline norms for self-perceived body image in the general population would be useful. This is the prerequisite for building a body of knowledge about how body image tends to vary with different conditions and how body image changes with treatment of those conditions. This study aims to discern these norms, as measured by the Multidimensional Body-Self Relations Questionnaire (MBSRQ) in a general Australian population and in turn use them as a point of comparison for a common condition that plastic surgery patients present with—breast hypertrophy. The MBSRQ is a commonly used measurement tool for assessment of self-perceived body image that was devised based on a 1985 United States national survey and used the data from 996 men and 1070 women.1
There are two key motivations behind this study. First, a recent comparison of normative scores by our team for another patient-reported outcome measure, the BREAST-Q reduction module, demonstrated significant variance between US and Australian normative scores.2 Given the only available scores for the MBSRQ are from the US in 1986, this led us to believe these scores may not be an accurate measure of an Australian population in 2021.
Second, operative and non-operative breast hypertrophy participants were investigated as this common condition is known to be associated with reduced health-related quality of life, including mental and emotional wellbeing.3 There is, however, little information in the literature about the body image of these women and how it differs from a general population.
Methods
Multidimensional Body-Self Relations Questionnaire
The MBSRQ is a validated patient-reported outcome measure for the assessment of body image, physical activity and health.1,4 Two versions of the MBSRQ are available: the full version (comprising 69 items) and the 34-item MBSRQ-Appearance Scales (MBSRQ-AS) version. The MBSRQ-AS version was used in this study because it contains the measures most relevant to understanding appearance-related body image and its possible relation with plastic surgery. It consists of five scales: Appearance evaluation, Appearance orientation, Body areas satisfaction, Overweight preoccupation and Self-classified weight. Scores were generated on a scale of one to five according to the scoring algorithms of the developer.5 Higher scores on evaluation and satisfaction scales represent a person feeling more satisfied, whereas higher scores for the orientation scale indicates a greater importance a person places on their appearance. Higher scores for Overweight preoccupation indicate a greater concern about weight while higher scores for Self-classified weight indicate a greater perception of being overweight. Previously published normative data from the United States population1,5 and data from the Australian breast hypertrophy surgical and control groups were used for comparison.
Participant recruitment and data collection
Normative study participants
For the normative component of the study, Australians aged 18 years and above who were registered members of a national online survey company, Pureprofile (Pureprofile Pty Ltd, Sydney, Australia) were invited to participate in the study in June 2021. Information sheets detailing the study were available for participants to read prior to consenting to the study by completing the questionnaires.
Participants were required to complete the questionnaires and provide information for the following variables: age, sex, postcode, height, weight, marital status, employment status, occupation, highest level of education, country of birth and ancestry. Participants were recruited to achieve distribution across sex, age and geographical variables as per the Australian population from the 2016 Census conducted by the Australian Bureau of Statistics.6
Surgical cohort
A prospective cohort study of women aged 18 years and over with symptomatic breast hypertrophy who underwent bilateral breast reduction surgery at Flinders Medical Centre in Adelaide, Australia, was conducted between April 2007 and February 2016. This study explored various aspects of health-related quality of life and cost effectiveness with a range of instruments, the MBSRQ being one part of this investigation. Results of the other outcomes have been published elsewhere.2,3 Participants were asked to complete the MBSRQ preoperatively and at 12 months following surgery.
Hypertrophy control cohort
A control group of women with breast hypertrophy who were actively seeking breast reduction surgery but had not yet had surgery were recruited for comparison with the surgical cohort. Women aged 18 years and above who were referred by their general practitioner for consultation for bilateral breast reduction surgery were invited to participate in the study and complete the MBSRQ at baseline and at the 12-month time point on the waiting list for consultation.
Ethics approval
Ethics approval for the normative study was obtained from the Flinders University Social and Behavioural Research Ethics Committee (approval number 2972). Ethics approval for the breast hypertrophy participants was obtained from the Southern Adelaide Clinical Human Research Ethics Committee (approval numbers 118.056 and 73.17).
Statistical analysis
Statistical analyses were performed using SPSS v25.0 statistical software (IBM Corp, Armonk, New York, USA). Descriptive statistics were calculated and included the mean, standard deviation and 95 per cent confidence intervals. Categorical variables were presented as frequencies and percentages. Comparisons of MBSRQ-AS scores were made between groups using an independent samples t-test or a one-way analysis of variance (ANOVA). Body mass index (BMI) was calculated from reported height and weight values (kg/ m2). Categorical variables were compared using chi-square (χ2) statistics or Fisher’s exact test as appropriate. Multiple regression analysis was used to determine which socio-demographic variables, if any, were predictors for individual MBSRQ-AS scale scores. Statistical significance was established at a p-value of less than 0.05.
Results
Participant characteristics
Of the 1125 panellists who opted to participate in the normative study, 1050 were eligible after completing the age-filtering question and 1016 fully completed the survey questions (97% completion rate). Participant demographics from the Australian normative study and how they compare to the 2016 Census are summarised in Supplementary Table 1. The mean participant age was 47.1 years (SD 17.1) with a median age of 46 years (range 18 to 89 years). The population sample was found to be statistically representative of the Australian population with regard to sex, age, obesity status, marital status, occupation, country of birth, ancestry and geographical distribution, although was not representative in terms of level of education, with participants on average having a higher level of education than the general population.
A total of 209 surgical and 161 hypertrophy control participants completed the MBSRQ at baseline; 191 and 124 participants respectively completed the MBSRQ 12 months later. Demographic characteristics and clinical outcomes for these participants have been published elsewhere.3 Importantly, there were no significant differences in baseline characteristics including age, BMI, obesity status and smoking status between the two cohorts.
Australian MBSRQ-AS normative scores
Mean normative scores for the MBSRQ-AS scales from the general Australian population derived in this study are summarised in Table 1. An independent t-test was used to compare mean scores for males and females and statistically significant differences were found in all five scales. Scores were significantly lower in females for Appearance evaluation and Body areas satisfaction whereas scores for Appearance orientation, Overweight preoccupation and Self-classified weight were significantly higher when compared to male respondents. Women rated their own appearance less highly and were more dissatisfied with their bodies than men, and at the same time were more preoccupied with their appearance and their weight. The magnitude of the difference between the sexes in Self-classified weight was less, but nonetheless still significant. Scores for those who responded as gender non-binary were not reported in Table 2 due to the low number of respondents (n = 2). Their reported mean (± SD) scores are as follows: Appearance evaluation, 3.36 ± 0.30; Appearance orientation, 3.08 ± 0.94; Body areas satisfaction, 3.61 ± 0.08; Overweight preoccupation, 2.25 ± 0.71; and Self-classified weight, 3.0 ± 0.00.
Predictors of MBSRQ-AS scale scores
In terms of predictors of MBSRQ-AS scale scores, linear regression models for each of the MBSRQ-AS scales are shown in Table 2. Multiple regression models were run to predict MBSRQ-AS scale scores from candidate variables including sex, age, BMI, marital status, employment status and occupation.
Sex and BMI were found to be significant independent predictors of all five MBSRQ-AS scales. Sex and BMI were found to be similar predictors of Appearance evaluation and Body areas satisfaction, with low scorers tending towards being female and/or having a high BMI. Sex was the greatest determinant of Appearance orientation and Overweight preoccupation and BMI was the greatest determinant of Self-classified weight. Age was also significantly correlated for three of the scales, although to a lesser degree than sex and BMI. Being older was associated with lower Appearance orientation and Overweight preoccupation and higher Body areas satisfaction. Those who were married had a higher Body areas satisfaction and higher Overweight preoccupation than those who had never been married.
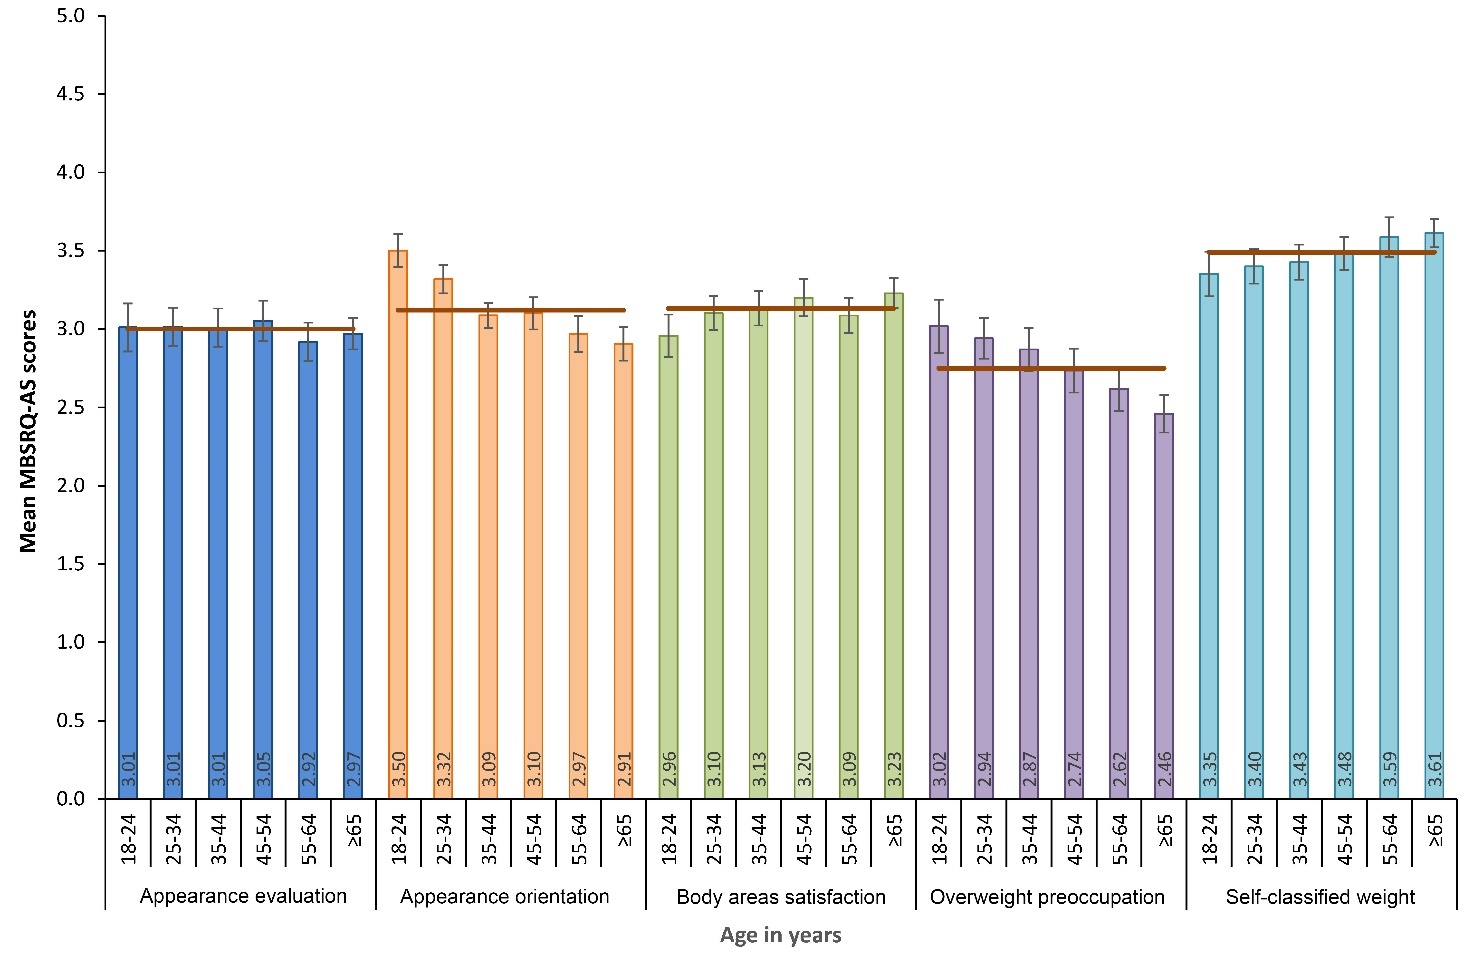
Figures 1 and 2 demonstrate the relationships between categories of age and BMI respectively, with mean scores for each scale of the MBSRQ-AS.
_in_years_vs_mean_scores_for_the_five_scales_of_the_mbsrq-as._error_bars_rep.jpeg)

Table 3 presents the mean values of the MBSRQ-AS scales stratified by sex as well as age. In general, the variation with age was consistently small for each domain and in nearly all cases smaller than the difference between men and women. For example, within female participants, the oldest category of women scored their appearance the lowest, and the youngest cohort of women scored their appearance with a mean score 0.14 higher; however, the lowest of the scores of men was still a further 0.07 higher. Similarly, satisfaction with body areas had little variation between women of different ages and men of different ages, but a marked difference between men and women. Appearance orientation and Overweight preoccupation showed a clear decline with the age of respondent, despite a trend towards an increase in Self-classified weight. This suggests that, for both sexes, the perception of being more overweight does not correspond to greater preoccupation with weight and appearance and, as people become older, they are less concerned with their body image.
Comparison of normative MBSRQ-AS scores between normative population samples
Normative MBSRQ-AS scores were compared between the published United States population values5,7 and the Australian population reference values derived in this study. Table 4 compares the unadjusted mean scores for the five MBSRQ-AS scales stratified by sex. Australians overall rated their appearance less highly than their US counterparts and were less satisfied with areas of their body. Another difference was that Australians were less focused on their appearance (Appearance orientation) than the American sample. While US and Australian women had an identical rating of their own weight, Australian women tended to be less preoccupied with their weight than US women. This contrasts with the findings in men, where Australian men rated themselves as heavier and were also more preoccupied with their weight than their American counterparts.
Breast hypertrophy surgical and control cohorts
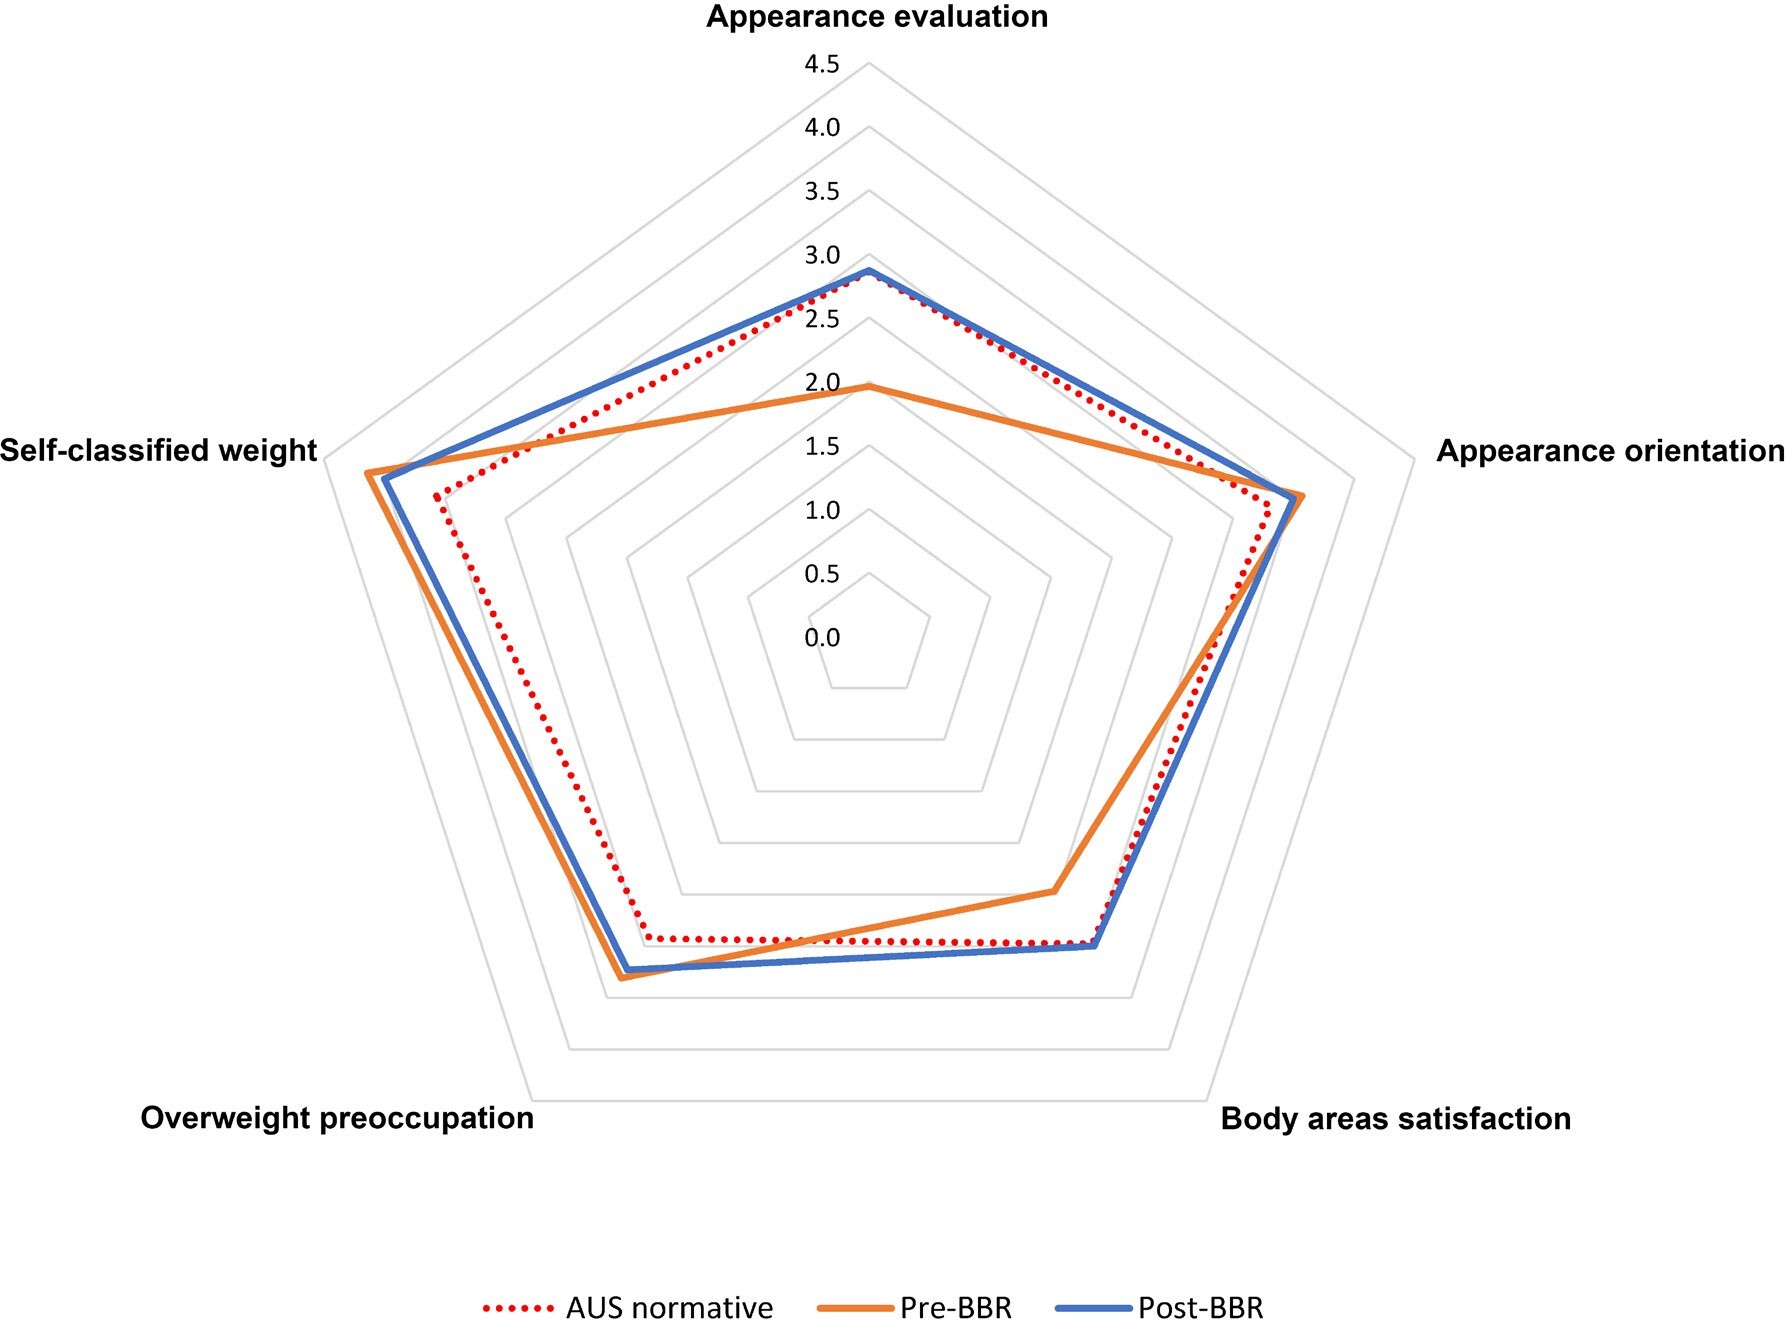
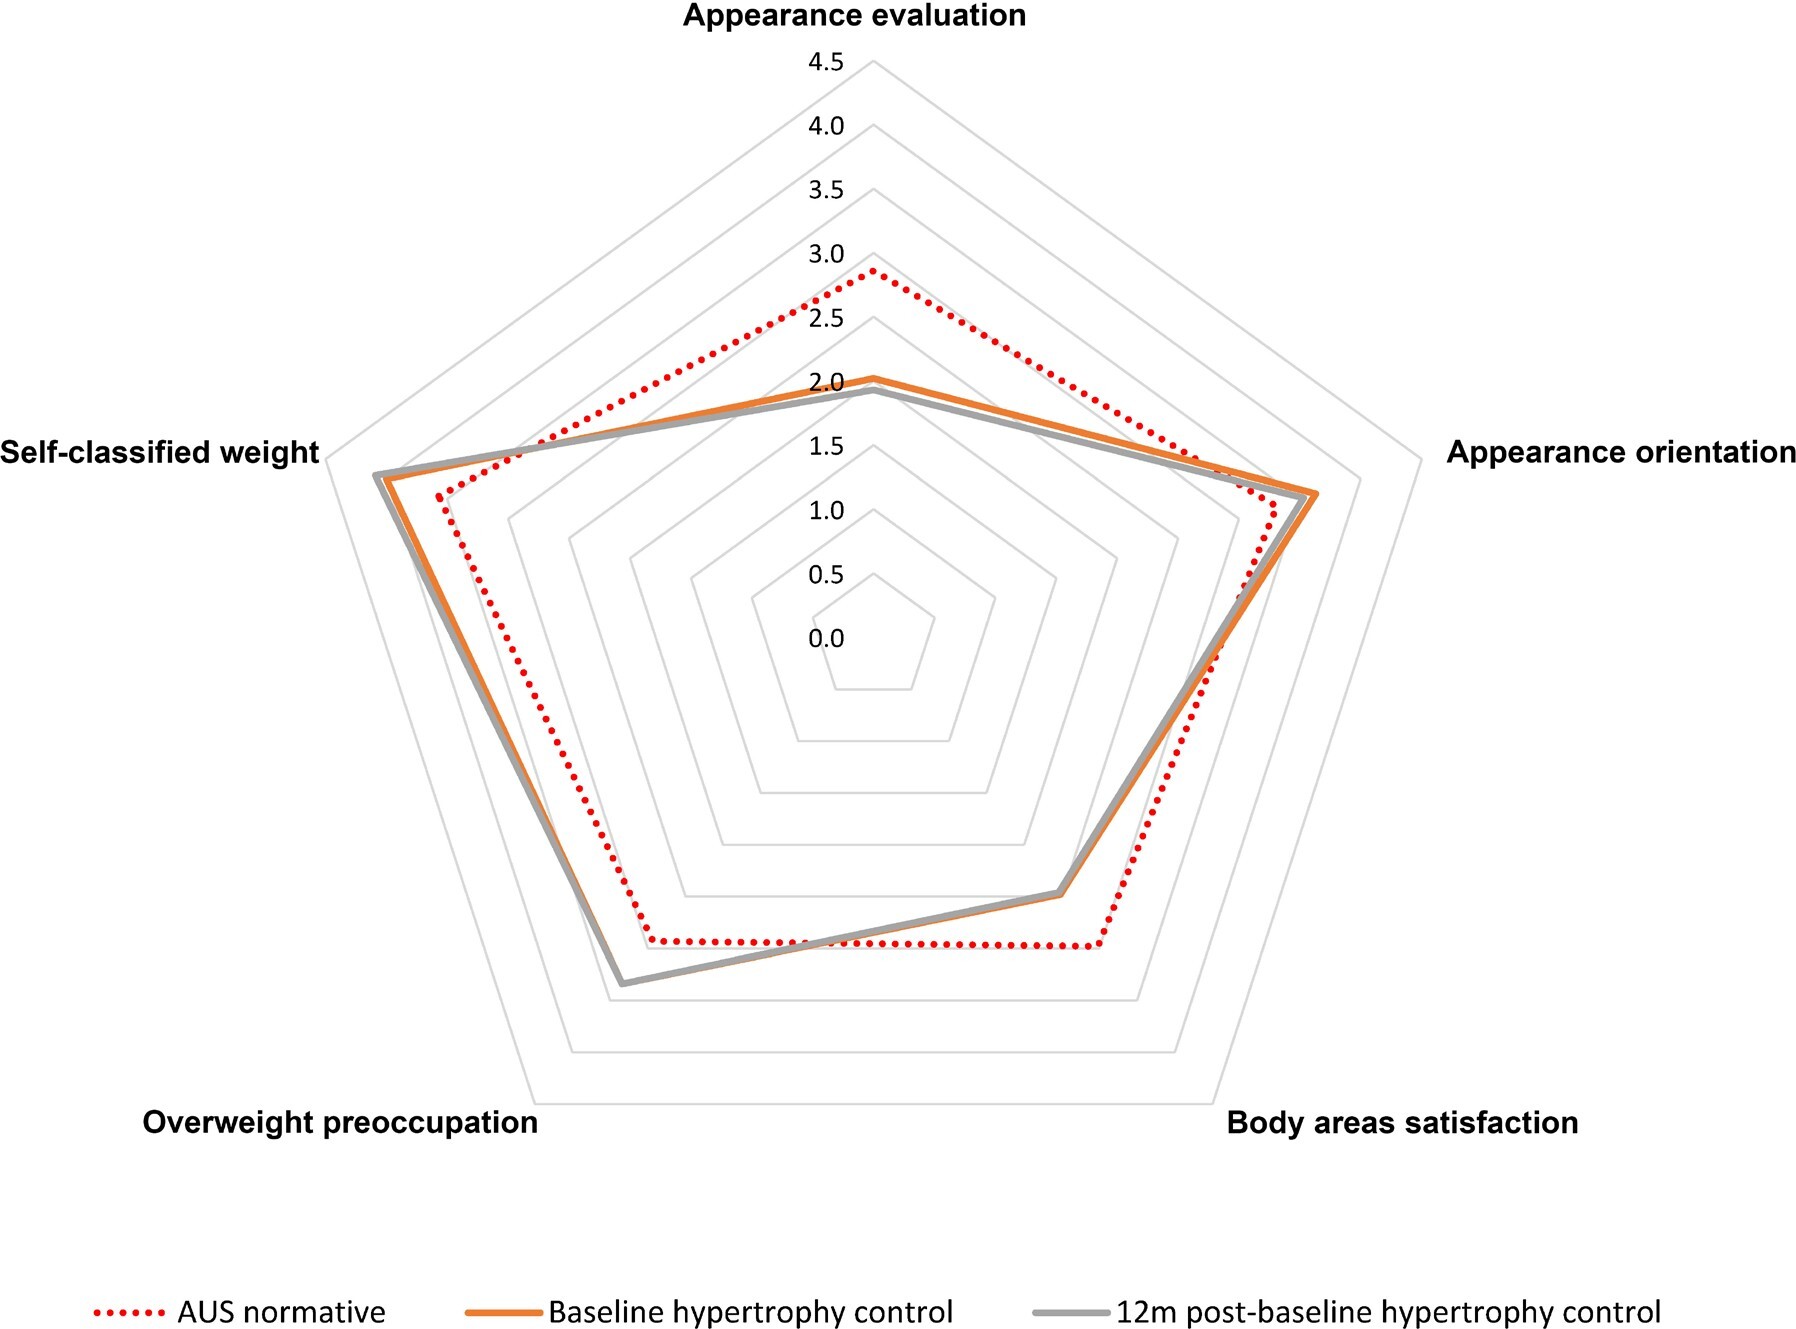
Mean MBSRQ-AS scores for surgical and breast hypertrophy control participants in comparison to population norms for Australia and the United States are presented in Table 5. When compared with normative data derived from women within the Australian general population, baseline scores for women with breast hypertrophy were significantly different in all five appearance scales. Women with breast hypertrophy scored lower for Appearance evaluation and Body areas satisfaction and were found to be more focused on their appearance, were more preoccupied with their weight and perceived themselves to be more overweight when compared to women within the general population. Women who underwent surgery displayed a significant improvement in scores in Appearance evaluation, Body areas satisfaction and Self-classified weight (Figure 3 and Table 5). They also tended to be less focused on their appearance and were less preoccupied with their weight; however, this change did not reach statistical significance (p = 0.097 and p = 0.052 respectively). At 12 months following surgery, MBSRQ-AS scores were ‘normalised’ and no significant differences were found in Appearance evaluation and Body areas satisfaction when compared to women in the general population. Following surgery, these women were also found to be significantly less focused on their appearance than women in the general population. However, while scores for Overweight preoccupation and Self-classified weight improved following surgery, these remained significantly higher compared to normative scores.
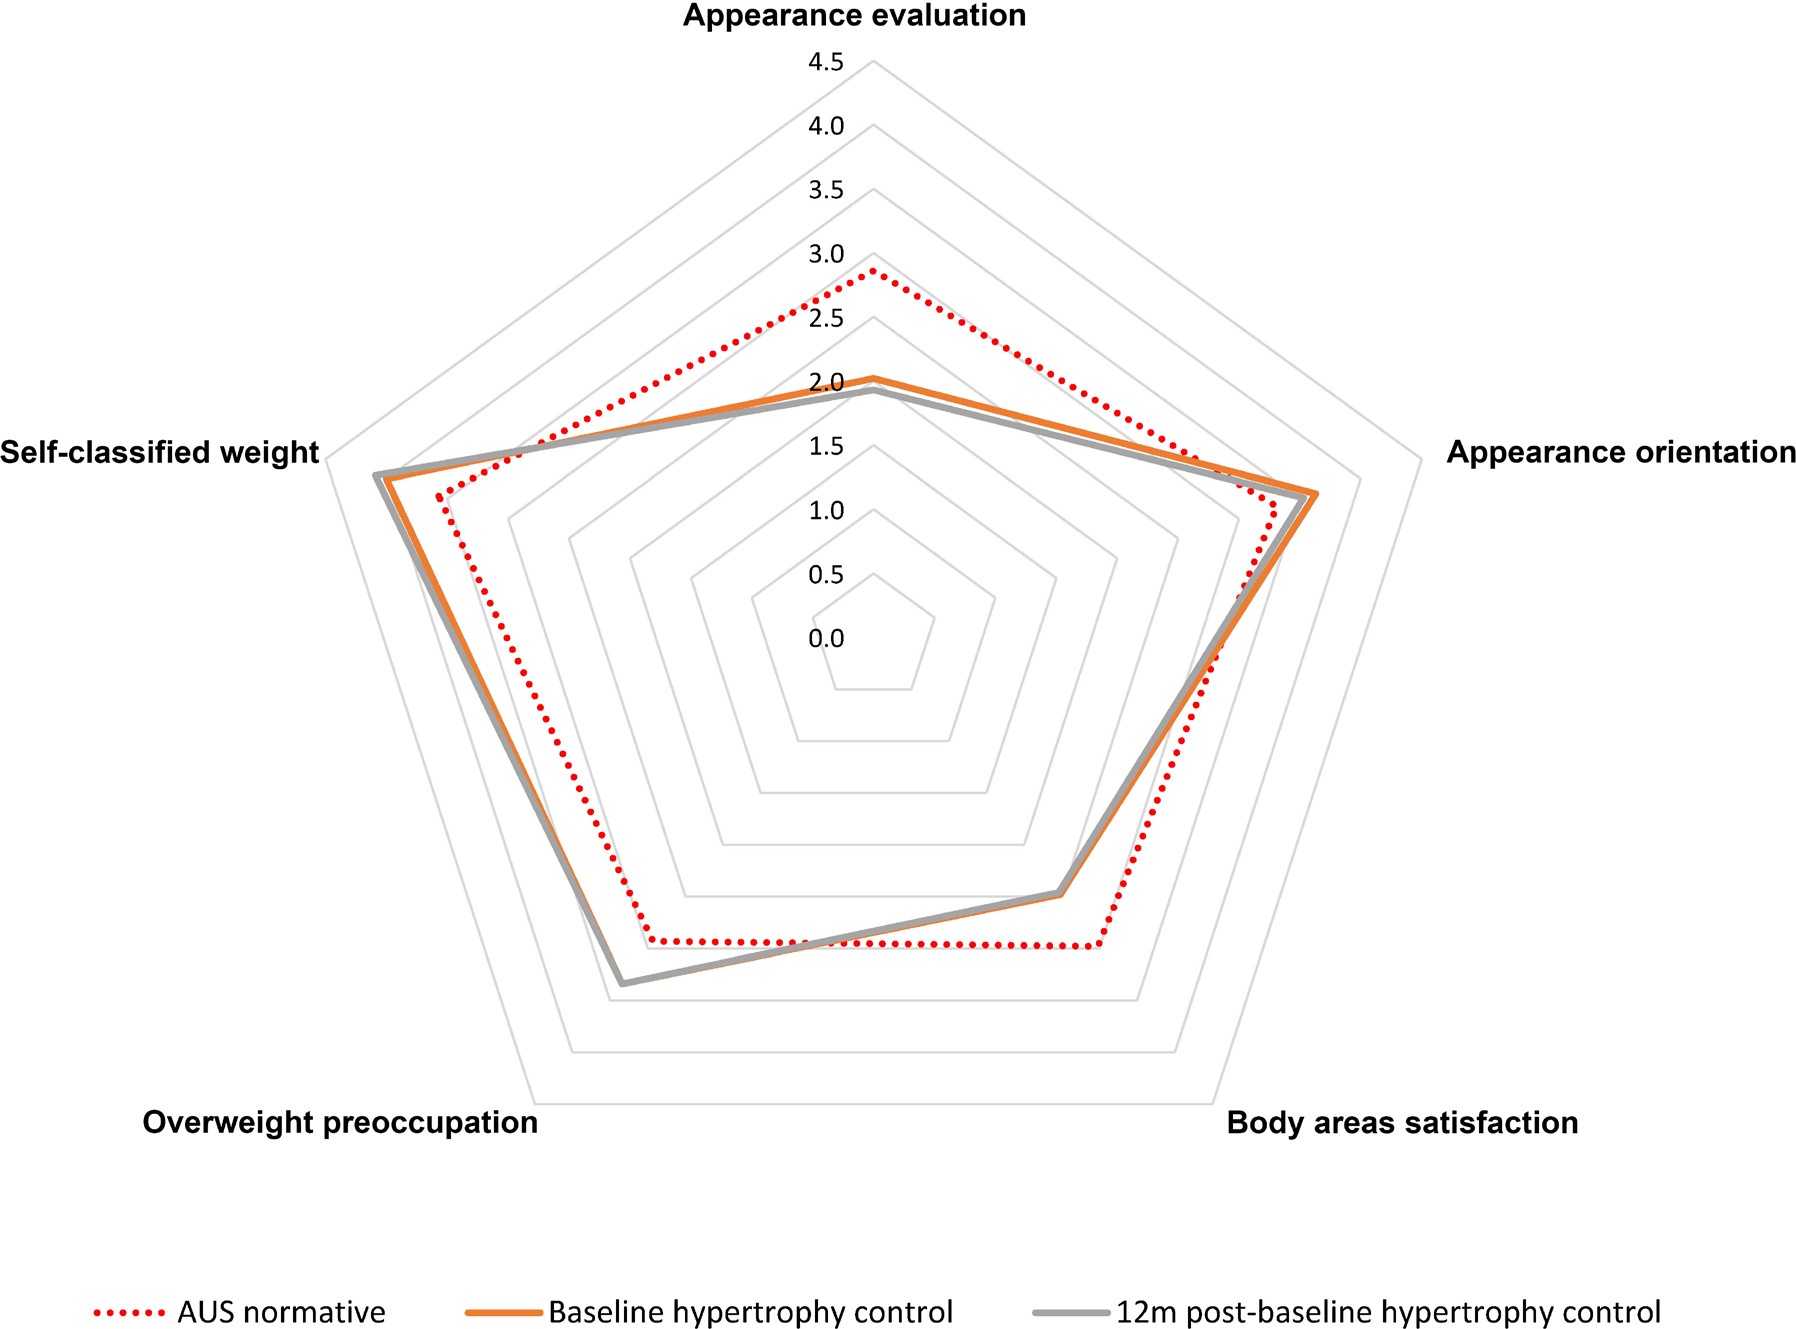
In contrast, a comparison of baseline and 12-month scores for women in the breast hypertrophy control group showed that scores did not improve over time (Figure 4). In fact, mean scores for women in the breast hypertrophy control group remained low and unchanged over the course of the study, with the exception of Appearance evaluation and Appearance orientation, which significantly declined over the 12-month period (Figure 4 and Table 5). When comparing the surgical cohort and the breast hypertrophy control cohort at their final assessment, women who underwent surgery were more satisfied with their appearance and were more satisfied with their body than those who did not undergo surgery.
Discussion
The findings of this study confirmed the two initial hypotheses. The normative study confirmed the hypothesis that MBSRQ normative values in an Australian population differ significantly from the US 1986 values.1 It also confirmed that women, on average, have lower body image perception than men and greater concern about their weight and appearance in general. The study of women with breast hypertrophy confirms the hypothesis that this condition has a negative effect on body image, with surgery helping to correct this.
Before the two key hypotheses are further discussed, it is relevant to discuss the socio-demographic determinants of body image. The findings of this study of a normative cohort were consistent with the existing literature in showing that sex is a key determinant of body image, with women consistently expressing greater dissatisfaction and higher preoccupation with their appearance than men. Previous studies have suggested this difference arises due to the disproportionate emphasis within the media and society more broadly on women’s appearance, along with unrealistic body image ideals.8,9 The relatively weak relationship between age and body image in the Australian normative population was perhaps surprising, given the well-known physical changes that occur in the ageing process. However, this was concordant with other Australian research; Tiggeman similarly found that, overall, body dissatisfaction was relatively stable across the adult lifespan, despite the fact that ageing caused increasing deviation from the societal ideals of beauty such as ‘thinness’ and ‘muscularity’. She found that as people aged, their dissatisfaction remained relatively stable because the importance of appearance to them decreased.10 Although a less significant determinant than sex, participants with higher BMI also had a poorer body image. This finding was consistent with other work describing the relationship between BMI and self-esteem, and may be explained by the phenomena of ‘anti-fat prejudice’ described by Crandall and colleagues in which heavyweight people face bullying and appearance-based discrimination in family, education, healthcare and workplace settings throughout their lives.11 Given the significant impact of these varying socio-demographic characteristics, it would be pertinent for researchers using the MBSRQ-AS for assessing surgical outcomes to control for these factors and stratifying their data according to sex.
With regards to how this study differs from the original 1986 US study, US scores were higher for both men and women in Appearance evaluation, Appearance orientation and Body areas satisfaction.1 Notably, however, the US study does show the same pattern of variation between sexes, with males across both studies reporting relatively higher Appearance evaluation and body satisfaction, and females reporting relatively higher Appearance orientation, Overweight preoccupation and Self-classified weight. Given the studies were also conducted 30 years apart, there is likely a factor of attitude change over time in relation to body image. The societal norms around images in the media, social media as an entity and exposure of children to body image-related content have all evolved in the 30 years since Cash’s original study.12 Nonetheless, the significant differences between the US and Australian scores demonstrate the need for country and time-specific normative studies.
The findings that women with breast hypertrophy have lower than average body image may be intuitive, but the ability to quantitatively measure this and document its correction with surgical treatment is not common in plastic surgery research. The findings of this study were consistent with a study by Thoma and colleagues in Canada, who used the MBSRQ as part of a bank of instruments for assessing outcome in breast hypertrophy patients. They found that preoperatively, women had an Appearance evaluation score of 2.28, which improved to an average score of 3.2 at 12 months following breast reduction surgery. This places postoperative Canadian women closer to the United States norms than those of Australia, but with a magnitude of improvement in score that is nearly identical (0.91).13 Our findings in women with breast hypertrophy also align with other previous studies.14–16 In regards to the utility of MBSRQ normative data for other plastic surgery research, the MBSRQ has been used to assess levels of body satisfaction in those undergoing abdominoplasty,17 rhinoplasty18 and breast reconstructive procedures.19 Despite concerns that the instrument may not be stable over time for some domains,20 it is likely that the MBSRQ will continue to be used in the field of health outcomes and a normative dataset for the Australian population will therefore be useful to clinicians and health researchers. The instrument has clearly been able to demonstrate the differences between breast hypertrophy patients and the Australian normative population and the effect of surgery on the levels of body image and satisfaction with appearance. This would suggest it is a useful tool in the armamentarium of health outcomes research in plastic surgery.
Limitations
This study has several potential limitations that should be noted. First, the process of participant recruitment in the normative study may not have necessarily provided a representation of the general Australian population. The Pureprofile panel used for participant recruitment in this study consists of panellists who voluntarily register to complete surveys, and this might introduce an element of selection bias. Second, while differences were observed in mean scores between the two population samples in four of the five MBSRQ-AS scales, a more comprehensive comparison of normative data and socio-demographic characteristics between Australia and the United States population samples was limited due to the absence of raw data from the US study.
Conclusion
The Australian population is a distinct population in terms of body image, as measured by the MBSRQ-AS. This normative dataset will be a useful baseline for future health-related research in Australian cohorts. Women with breast hypertrophy have a body image that is lower than that of the normal population and this improves with surgery.
Acknowledgements
The authors would like to thank the participants of this study, without whose input this study would not have been possible.
Patient consent
Patients/guardians have given informed consent to the publication of images and/or data.
Conflict of interest
The authors have no conflicts of interest to disclose.
Funding declaration
No external funding was received for this study. Departmental funds were used for Pureprofile data acquisition.